Data Dive to Study Homelessness
We are partnering with DataKind to describe LA's homeless population over time
What was the DataDive?
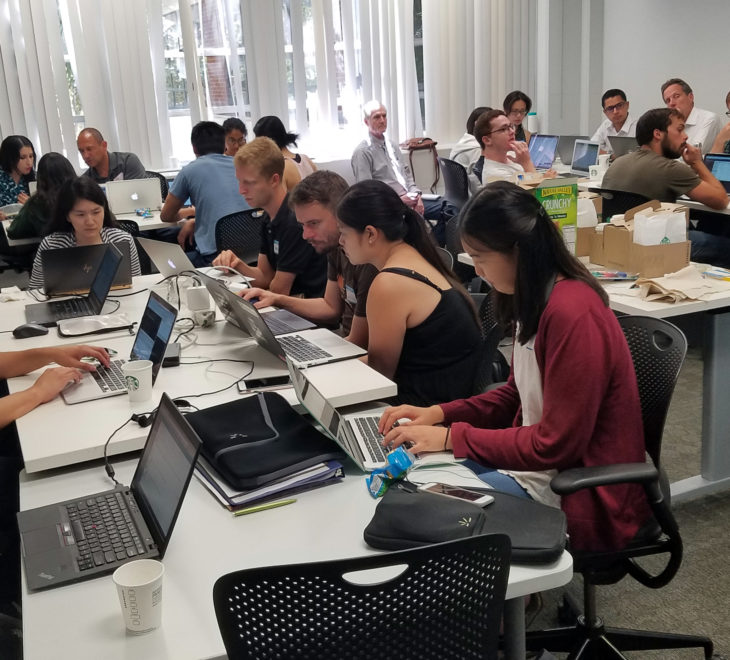
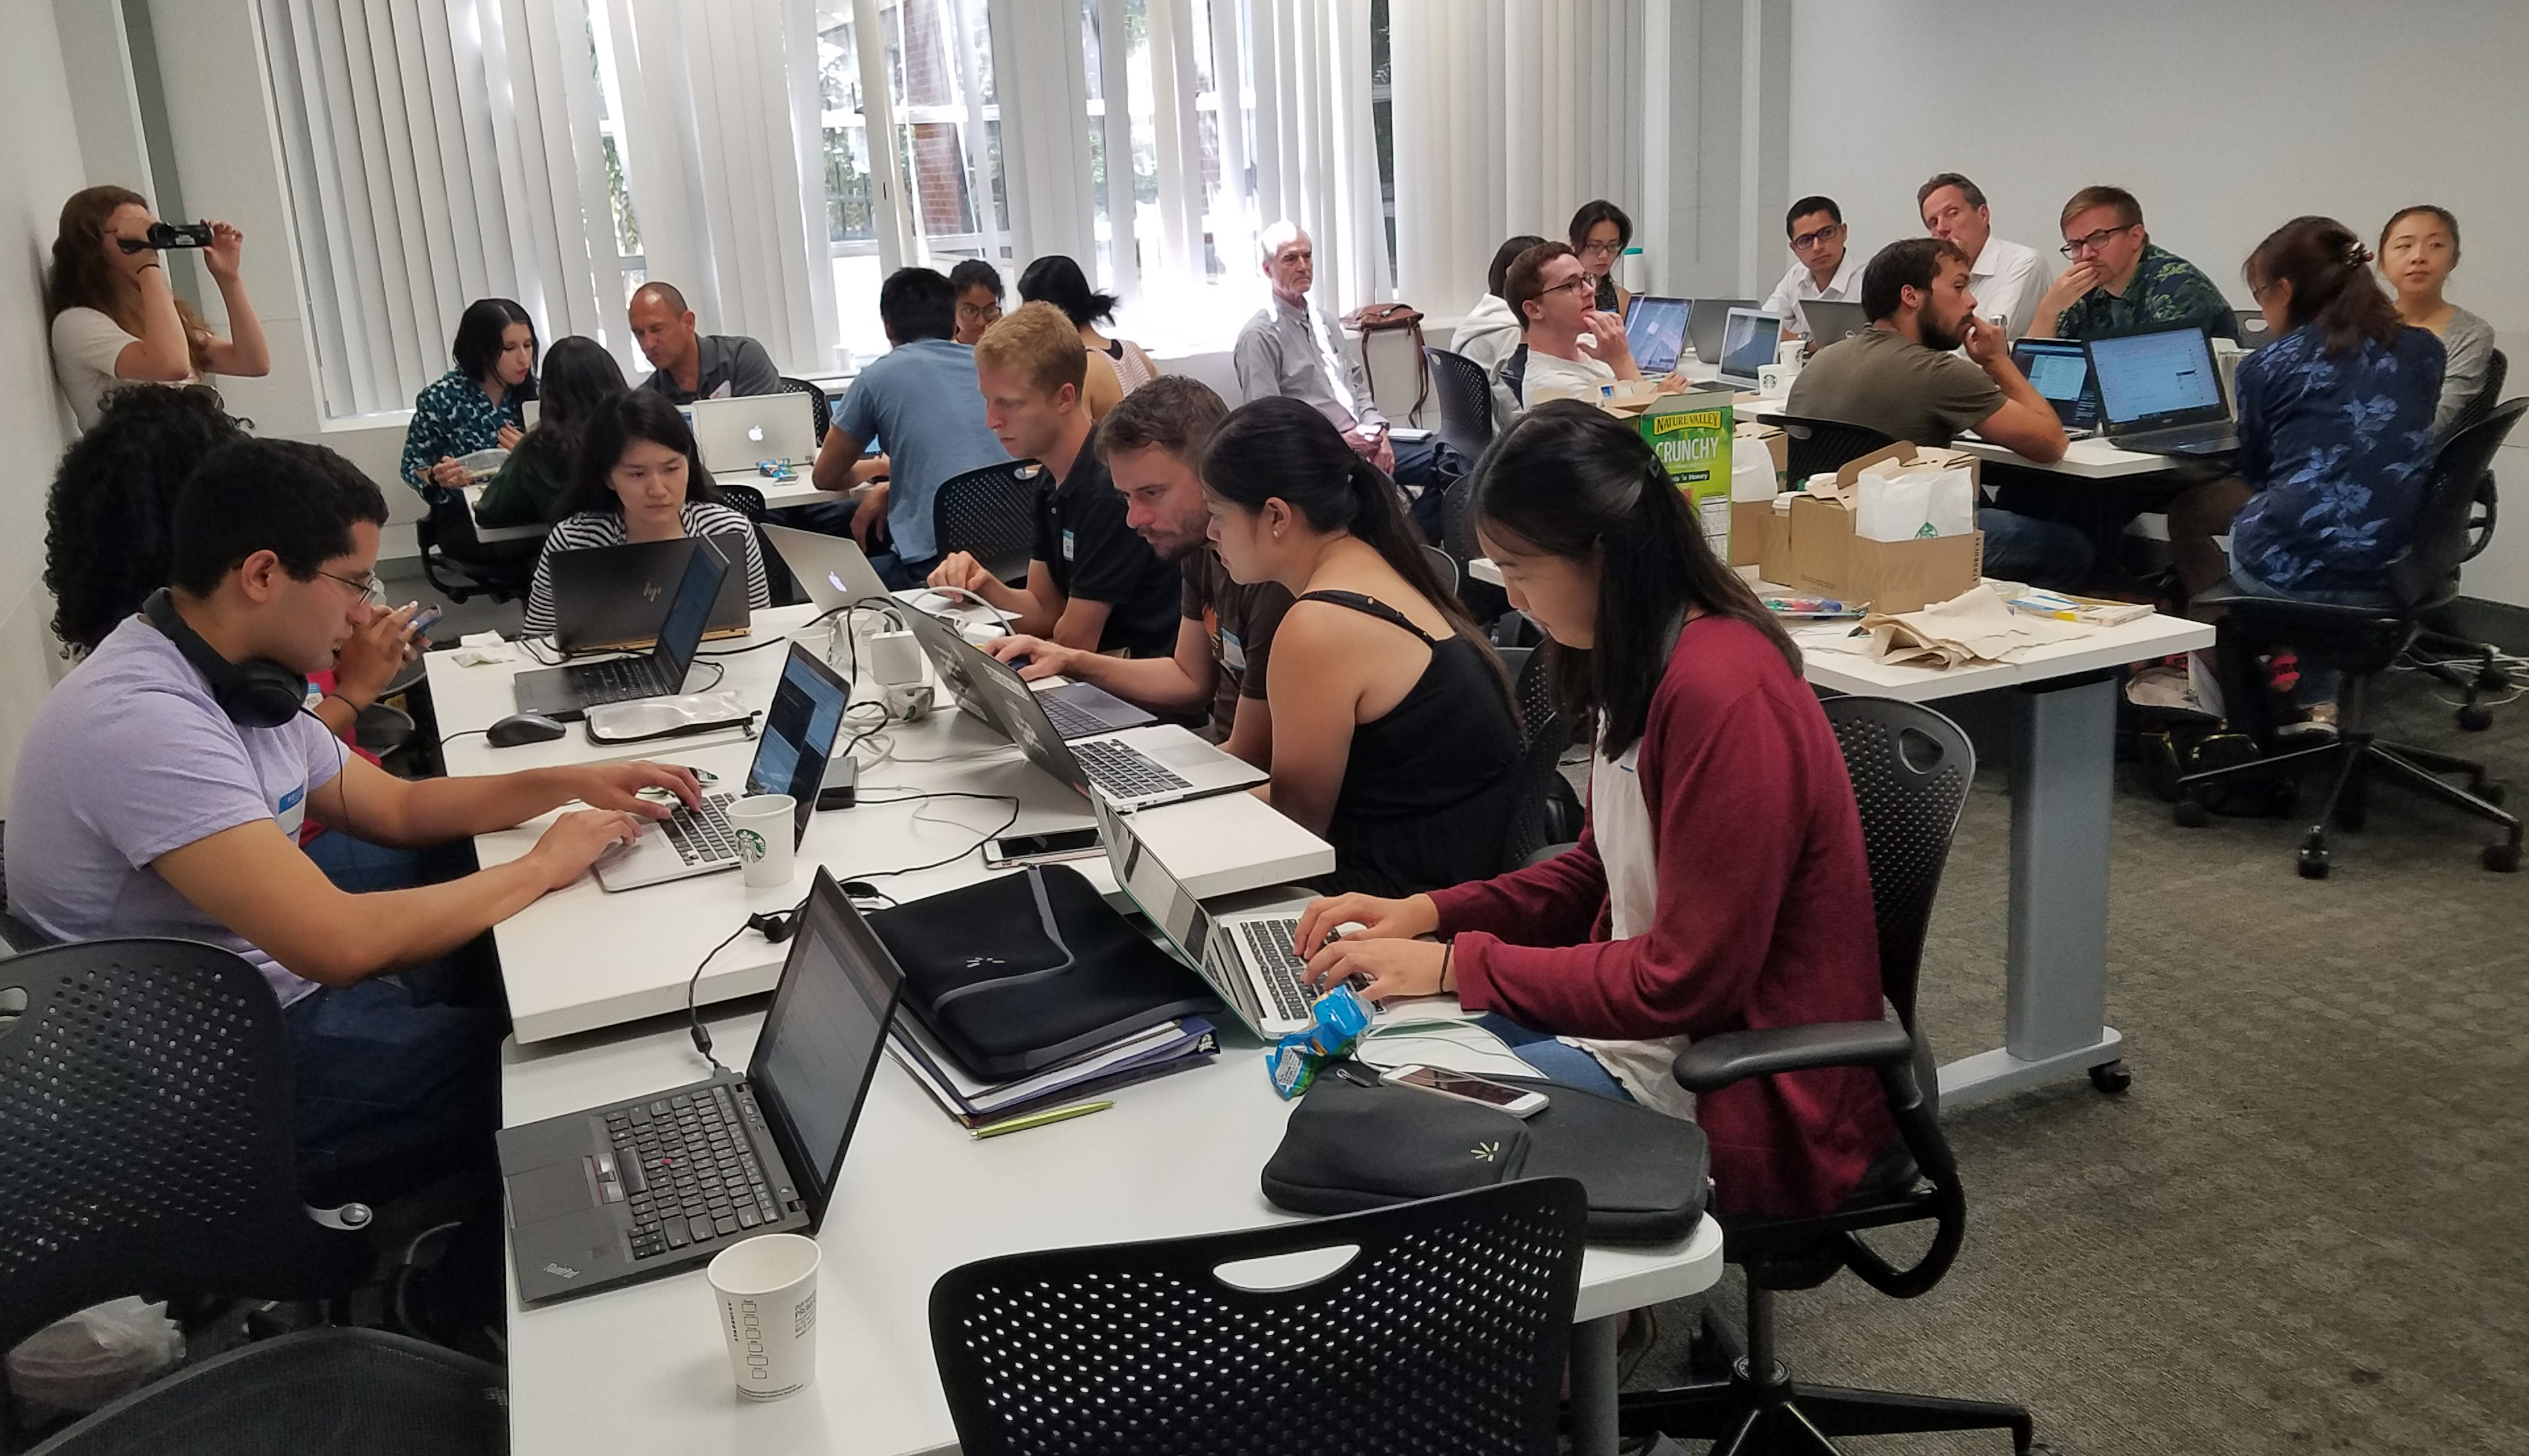
The Economic Roundtable partnered with the non-profit data-for-good organization DataKind to hold a simultaneous DataDive with 26 volunteer data scientists in Los Angeles and 15 in San Francisco on the weekend of July 21-22, 2018. The Los Angeles event was held at USC and the San Francisco event at SF State.
 At the DataDive, volunteer data scientists, DataKind Data Ambassadors, and we at the Economic Roundtable collaborated to answer the question: “Who experiences homelessness in Los Angeles over the course of a year?”
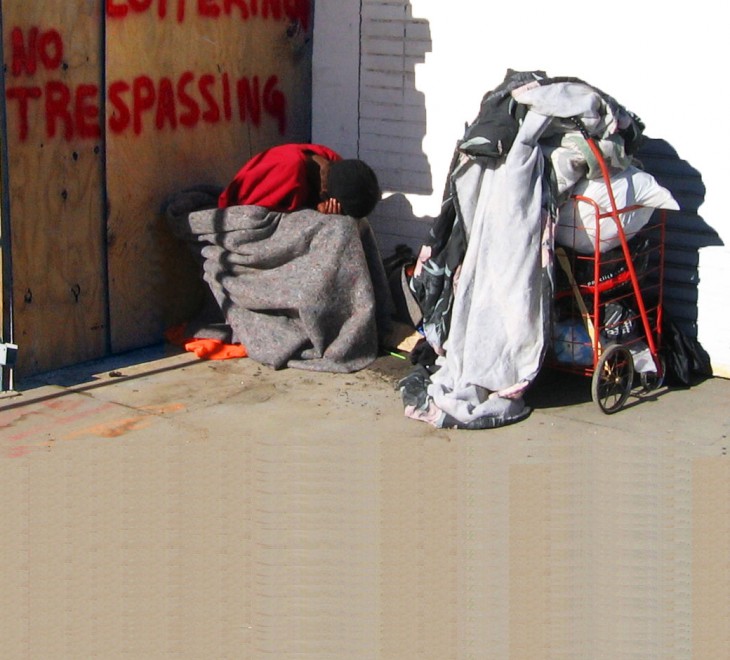
This is an unanswered question. The answer is important for understanding the total scope of homelessness and for identifying possibilities for helping homeless individuals earlier rather than later.
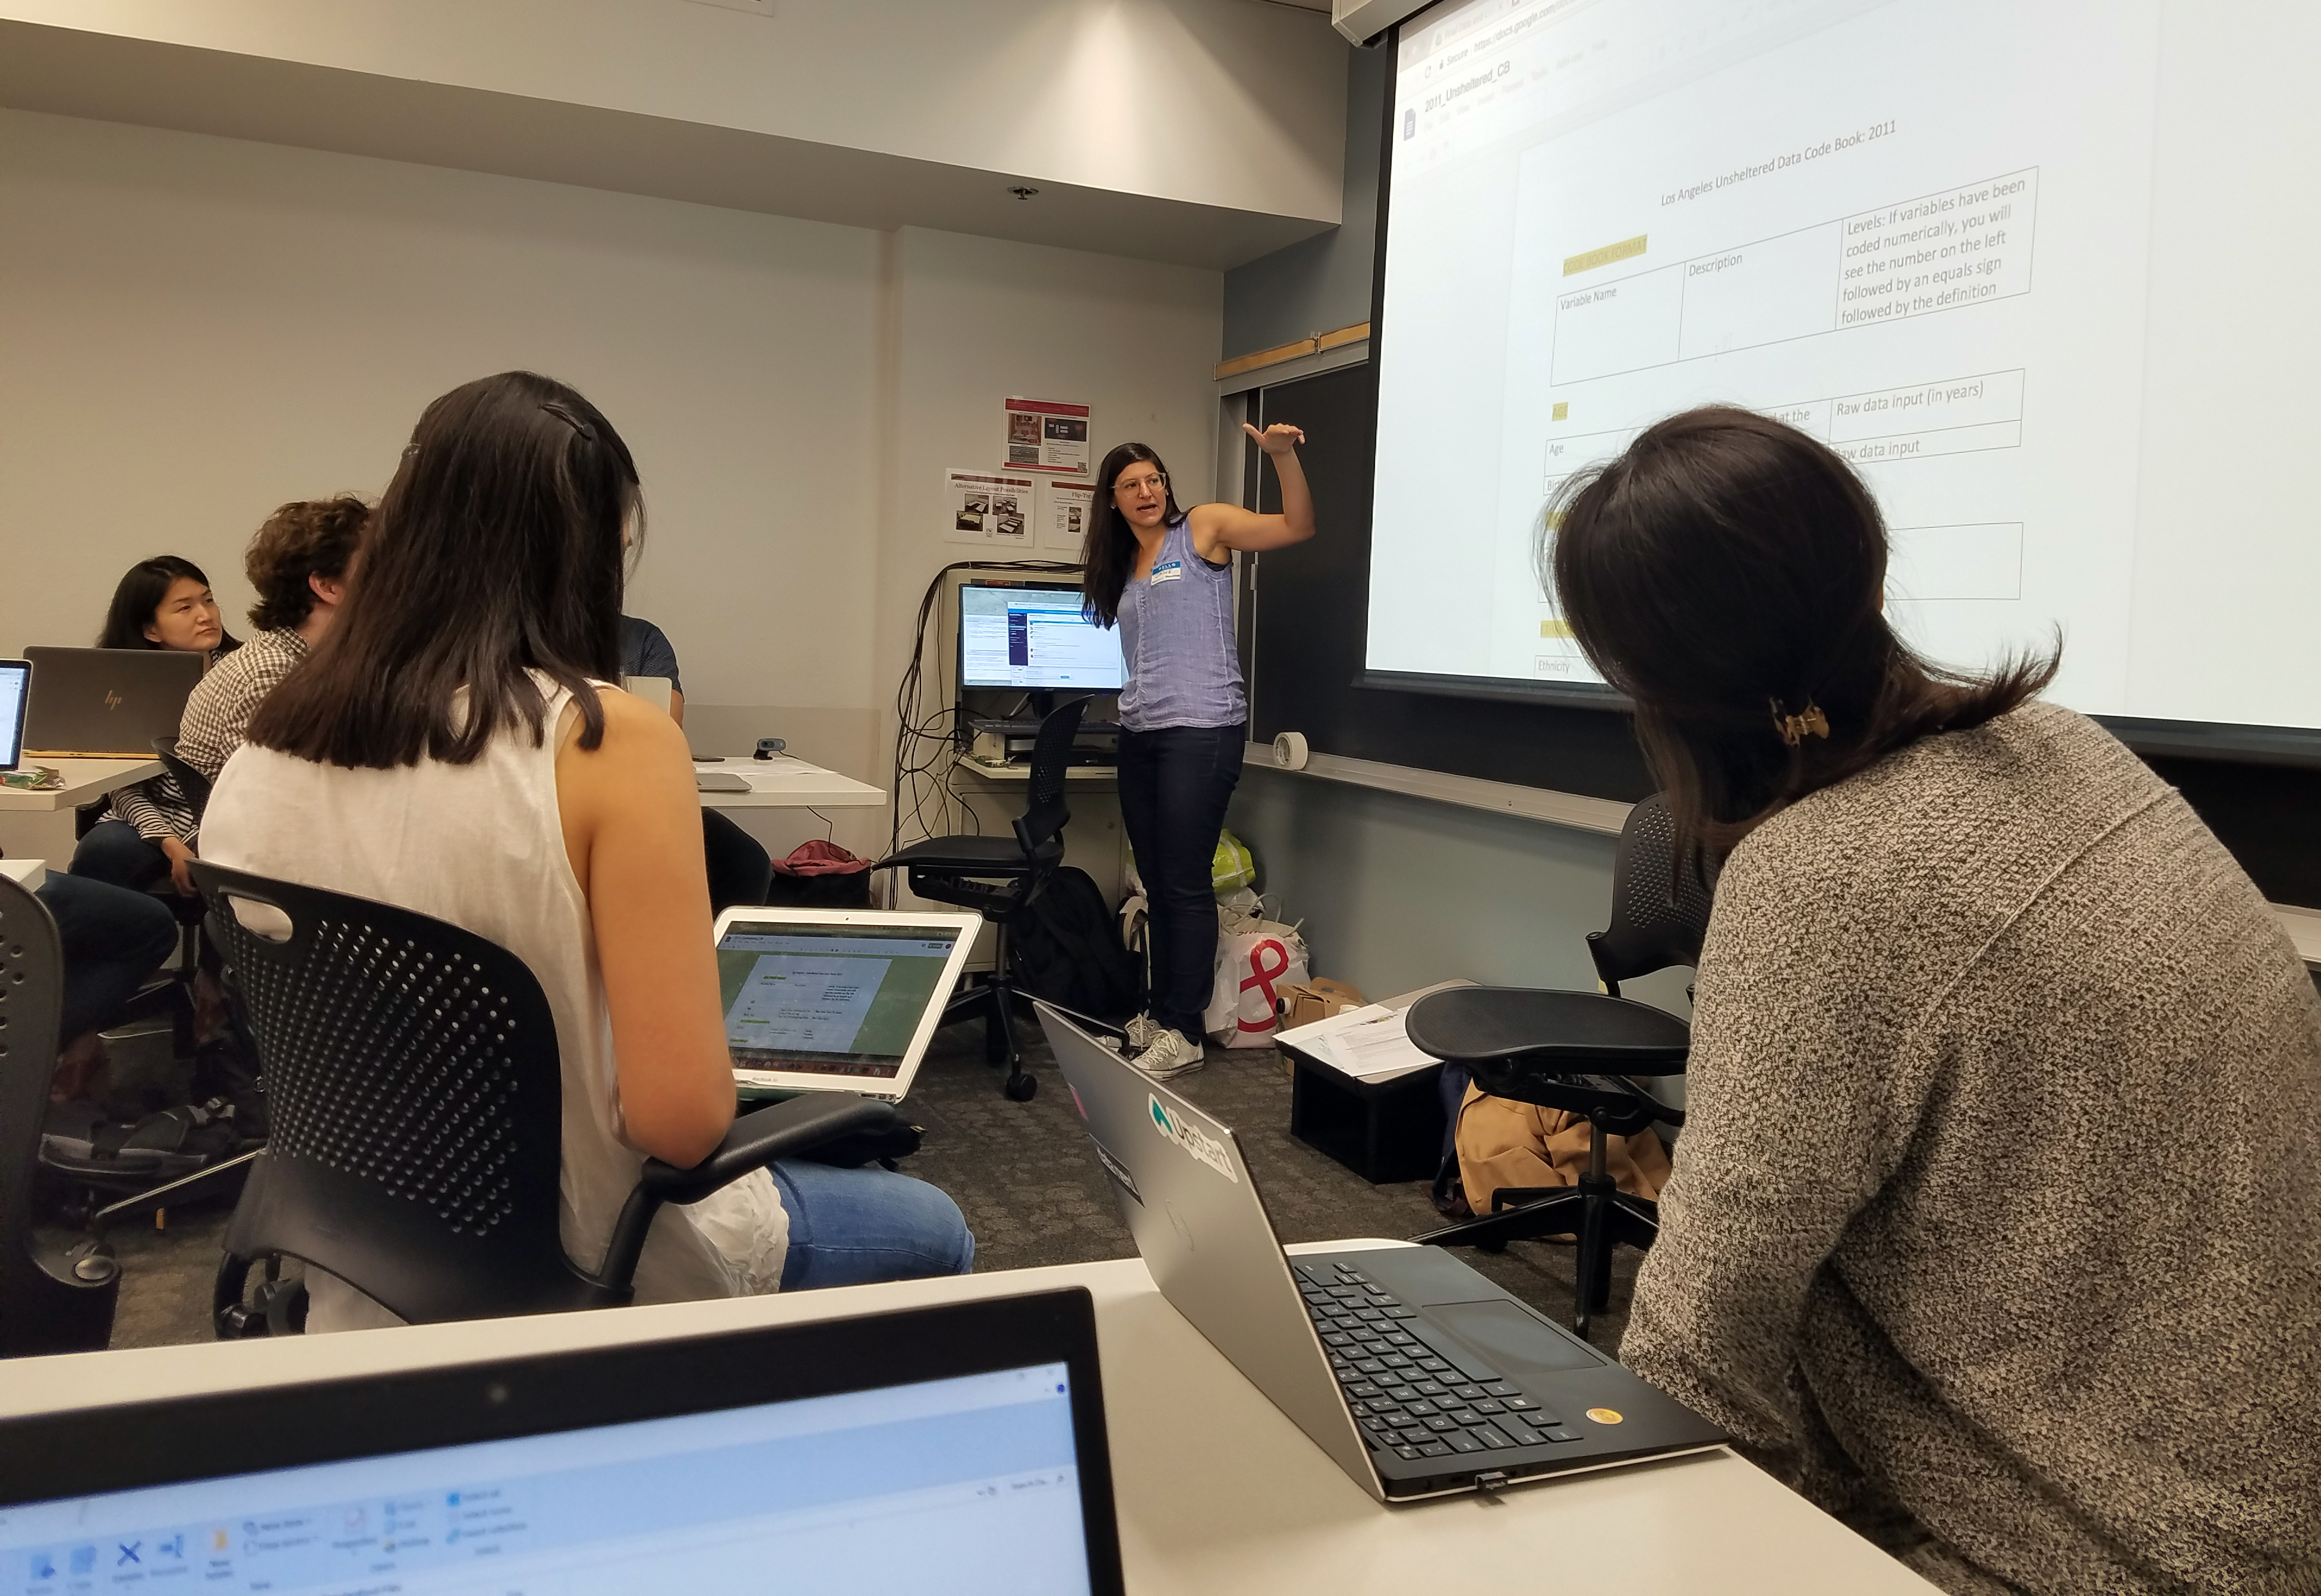
Volunteers at the data dive developed cutting-edge approaches to building a population model and as well as interactive data visualization tools, but did not have enough time to carry this work all the way to completion. The Roundtable is following through to complete this work, with Jane completing the homeless population model and Paul completing the interactive data visualization tools.
If you have questions or suggestions about the population model, contact us here. For questions or suggestions about the data visualization tools, contact us here.
 In April, the Economic Roundtable released the report Escape Routes, a meta-analysis combining 26 point-in-time data sets to provide a single panoramic description of people without homes in Los Angeles. Point-in-time estimates, though extremely valuable, do not immediately describe the dynamics of who is homeless over periods longer than a day, nor do they reflect the high turnover in the population.
Why are we interested in this question?
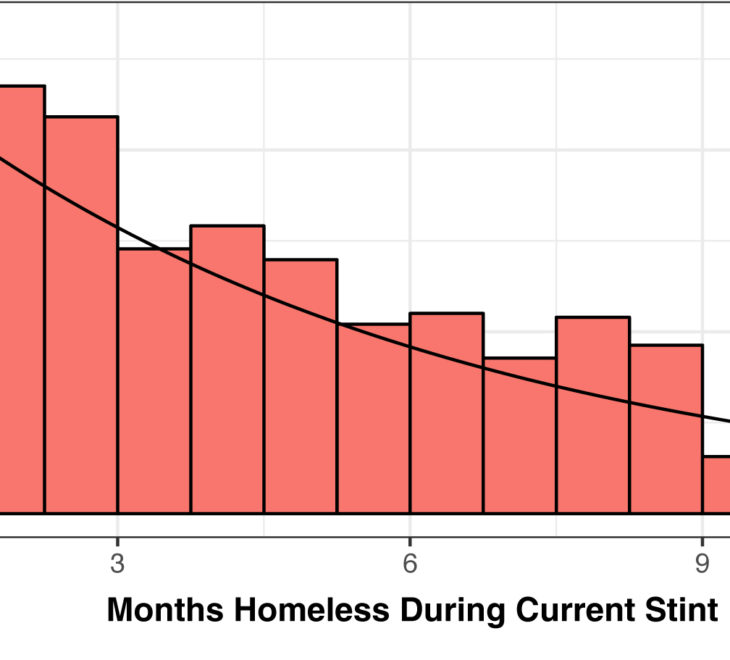
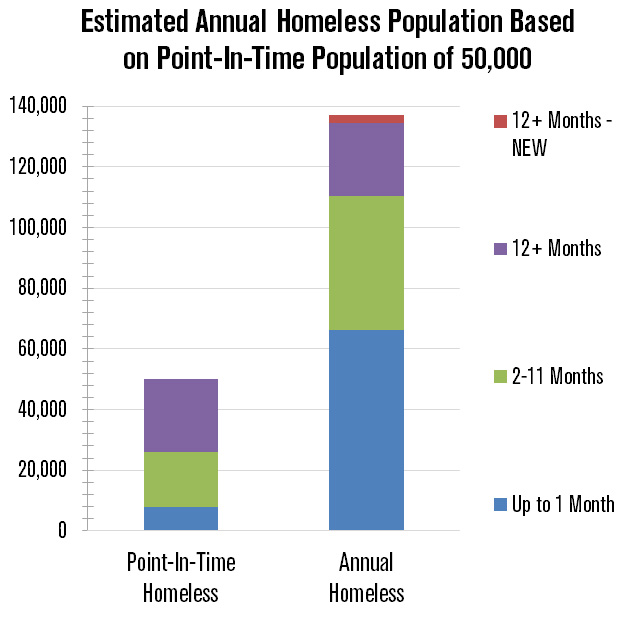 In Escape Routes, we presented a simple model to estimate the entire population that experiences homelessness over the course of the year (the annualized population) based on point-in-time data. On a given night, about half of the people experiencing homelessness have been homeless for over a year. However, our model suggests that group only accounts for a fifth of the annualized population. On the other hand, it is likely that half of the annualized population was homeless for only two months or less.
We frequently read that roughly 50,000 people are homeless in Los Angeles, yet the annualized population is probably two to three times as large. The difference between the point-in-time and annualized populations is under-acknowledged, but extremely important to policymakers and service providers.
Volunteers at the DataDive developed new approaches for improving on the simple annualized population model in Escape Routes, and expanding the scope of modeling targets and also creating dynamic visualizations to make information about homelessness more broadly accessible.
We are deeply grateful for the generosity of data scientists in Los Angeles and San Francisco who contributed their weekend to advancing our understanding of a very important issue at the intersection of data and policy.
PRESS COVERAGE AND ARTICLES
Tech experts offer skills to end homelessness
By Sophie-Marie Prime, USC Story Space (August 22, 2018)