This streamlined triage tool was developed for the Santa Clara County Center for Population Health Improvement (CPHI). It provides an empirical tool for prioritizing patients for permanent supportive housing using close-to-real-time data that is available to CPHI. In addition, an industry-wide switch in medical diagnostic classification systems necessitated a conversion of all diagnostic variables from the ICD-9 classification system to the ICD-10 system.
Past work in Santa Clara County to develop the Silicon Valley Triage Tool found that five percent of homeless individuals account for 47 percent of all public spending on the homeless. These individuals tend to have multiple obstacles to finding and retaining housing, such as physical and mental health problems, criminal justice system involvement, and social isolation.
In addition to demographic data, the triage tool in the earlier report uses data from eight public agencies: criminal justice, health care, mental health, homeless services, paramedics, probation, substance abuse services, and social services. Record linkages with the last four of these data sources were not feasible for the health care system, so the new, streamlined triage tool presented in this report was developed to accurately identify homeless individuals who will be in the highest cost decile in the coming year, based on data from just four public agencies over the past two years. This model remains strongly predictive despite data restrictions.
The data specifications listing the information required for the new, streamlined triage tool can be downloaded here:
The core of this updated triage tool is a predictive model of public spending on homeless individuals, predicting whether they will be in the costliest decile (“high-cost”) based on person-level characteristics previously observed. It is important that the model not only have predictive power, but also explanatory power, indicating the relative importance of the predictors. Parsimony in the model is also valuable for clarity of interpretation and to limit the administrative burden of implementing it.
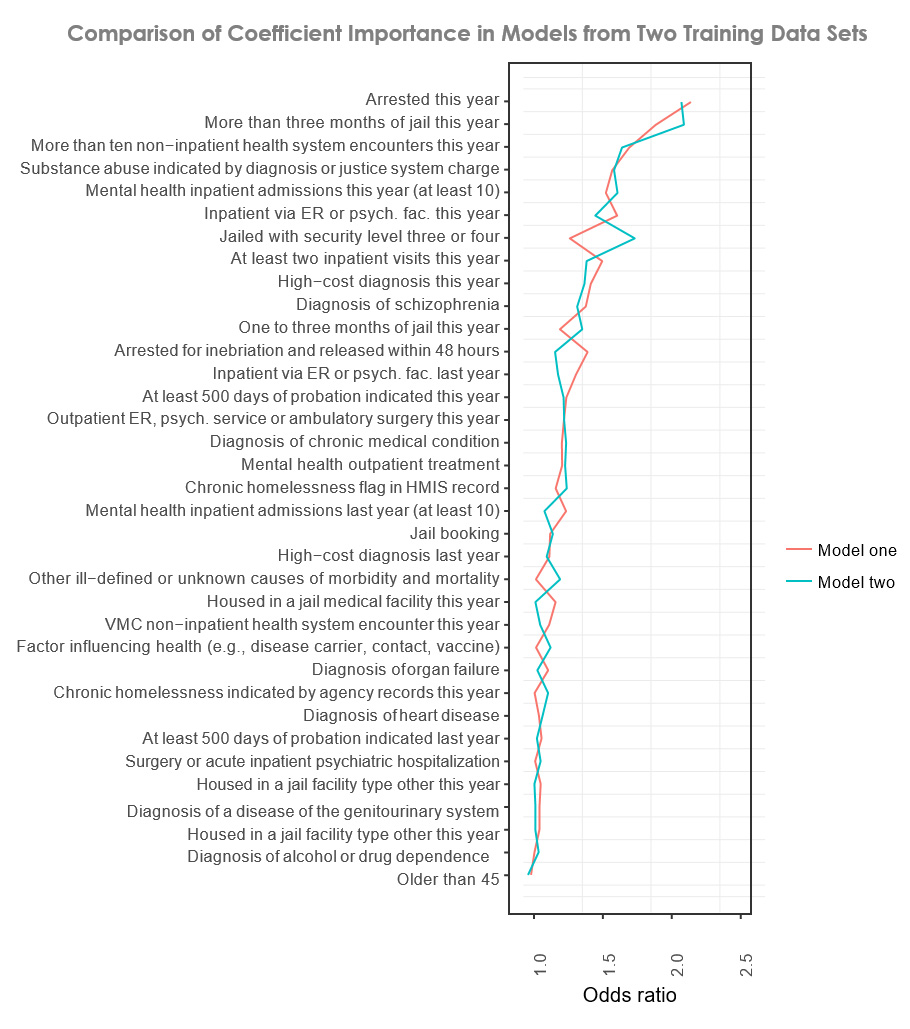 Whether an individual was arrested this year and whether they served more than three months in jail are the most powerful predictors in the model. Other top predictors are whether an individual had at least ten mental health inpatient admissions in both of the last two years and whether they had more than ten non-inpatient health system encounters this year.
Two separate data sets with different years of data were used to develop the final model and to test the consistency of the model in producing similar results when data from different years is used. The outcomes from both models are shown in the accompanying graph. Only a few major deviations appear. In terms of odds ratio, the importance of being jailed with security level three or four is higher in the second model, and being arrested for inebriation is higher in the first model. The overall agreement between the two models shows that our final model is capturing meaningful relationships.
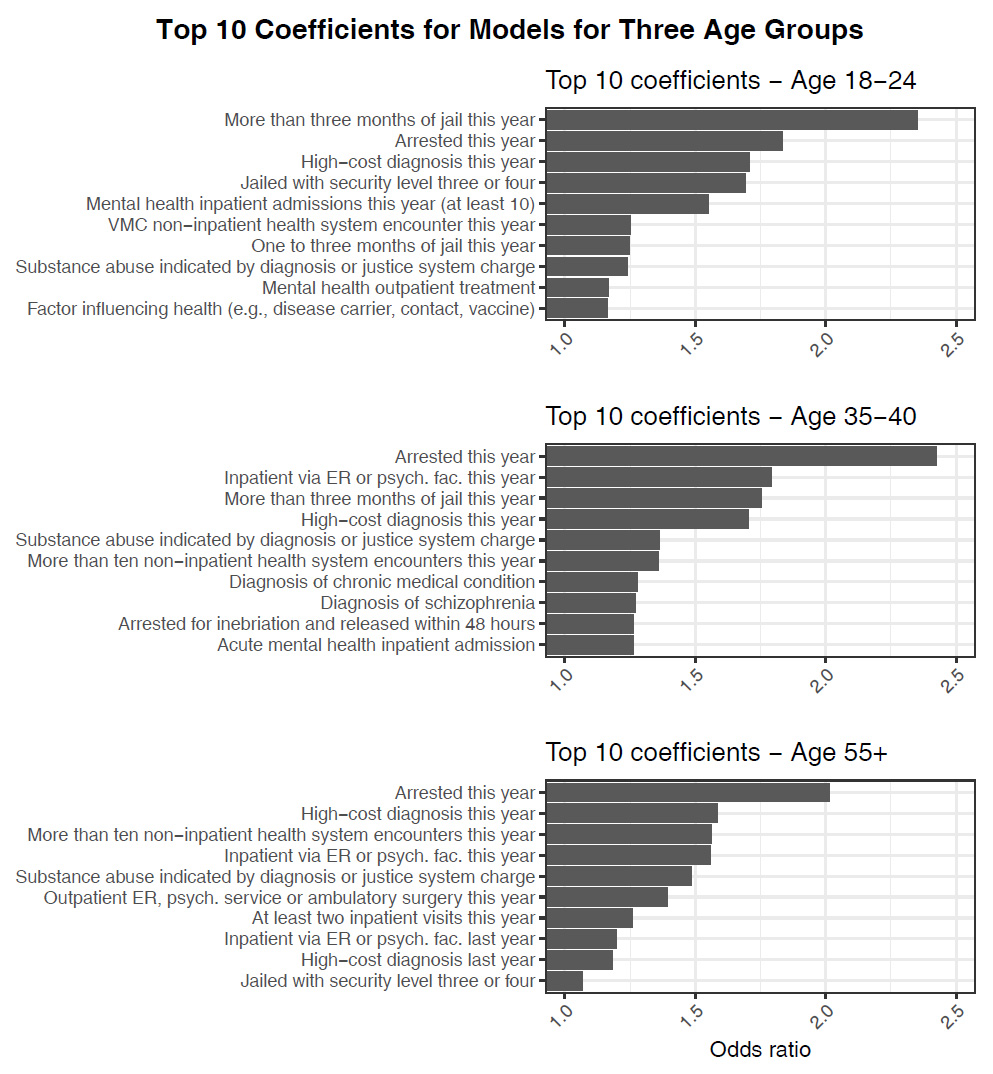
Predictive models for different age groups provide insights into how factors change and become more important over time. Whether an individual served at least three months in jail in the previous year is by far the strongest predictor for young adults. Mental health issues are important predictors for all age groups. Inpatient health care is an important predictor for the oldest group.
These results point to two general paths for entering the high-cost group. One depends only on high-cost medical diagnoses and medical treatment. It accounts for about a third of those predicted to be in the highest-cost decile and is more associated with older individuals. The other path depends heavily on criminal justice system involvement and is associated with younger individuals. The top ten predictors for each of the three age groups are shown in the graphs below.
