Reliable estimates of time spent homeless during a year are important for an evidence-based intervention framework. Understanding the prevalence of short-term versus persistent episodes of homelessness enables accurate allocation of resources based on differing levels of need. The prevailing approach to homelessness prevention and intervention is “progressive engagement.” This entails treating new entrants into homelessness with a light touch and providing progressively more intensive services as needed to help individuals re-establish themselves in stable housing. The most intensive and costly intervention, permanent supportive housing, is reserved for chronically homeless individuals for whom other interventions have failed. A population model that breaks out the annual homeless population by duration of homelessness can be used to help plan, budget and implement the range of services needed to help individuals with differing barriers to exiting homelessness.
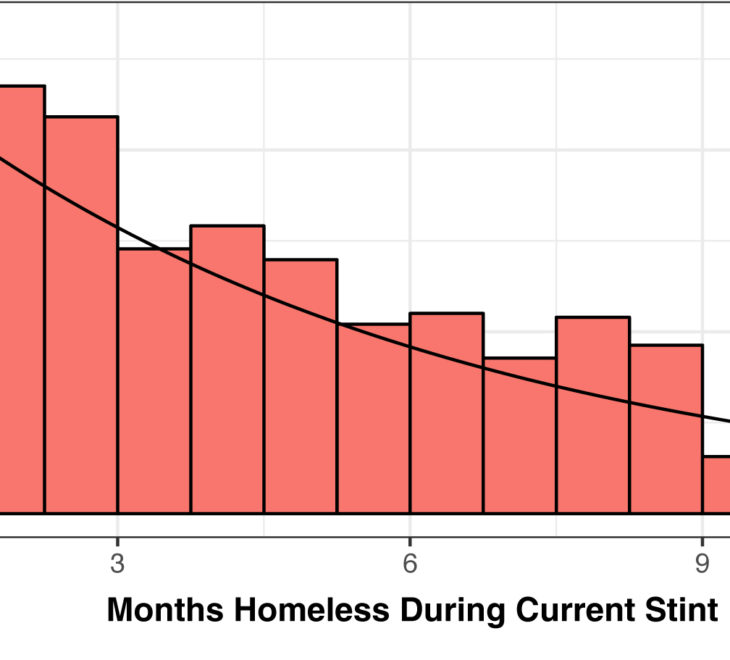
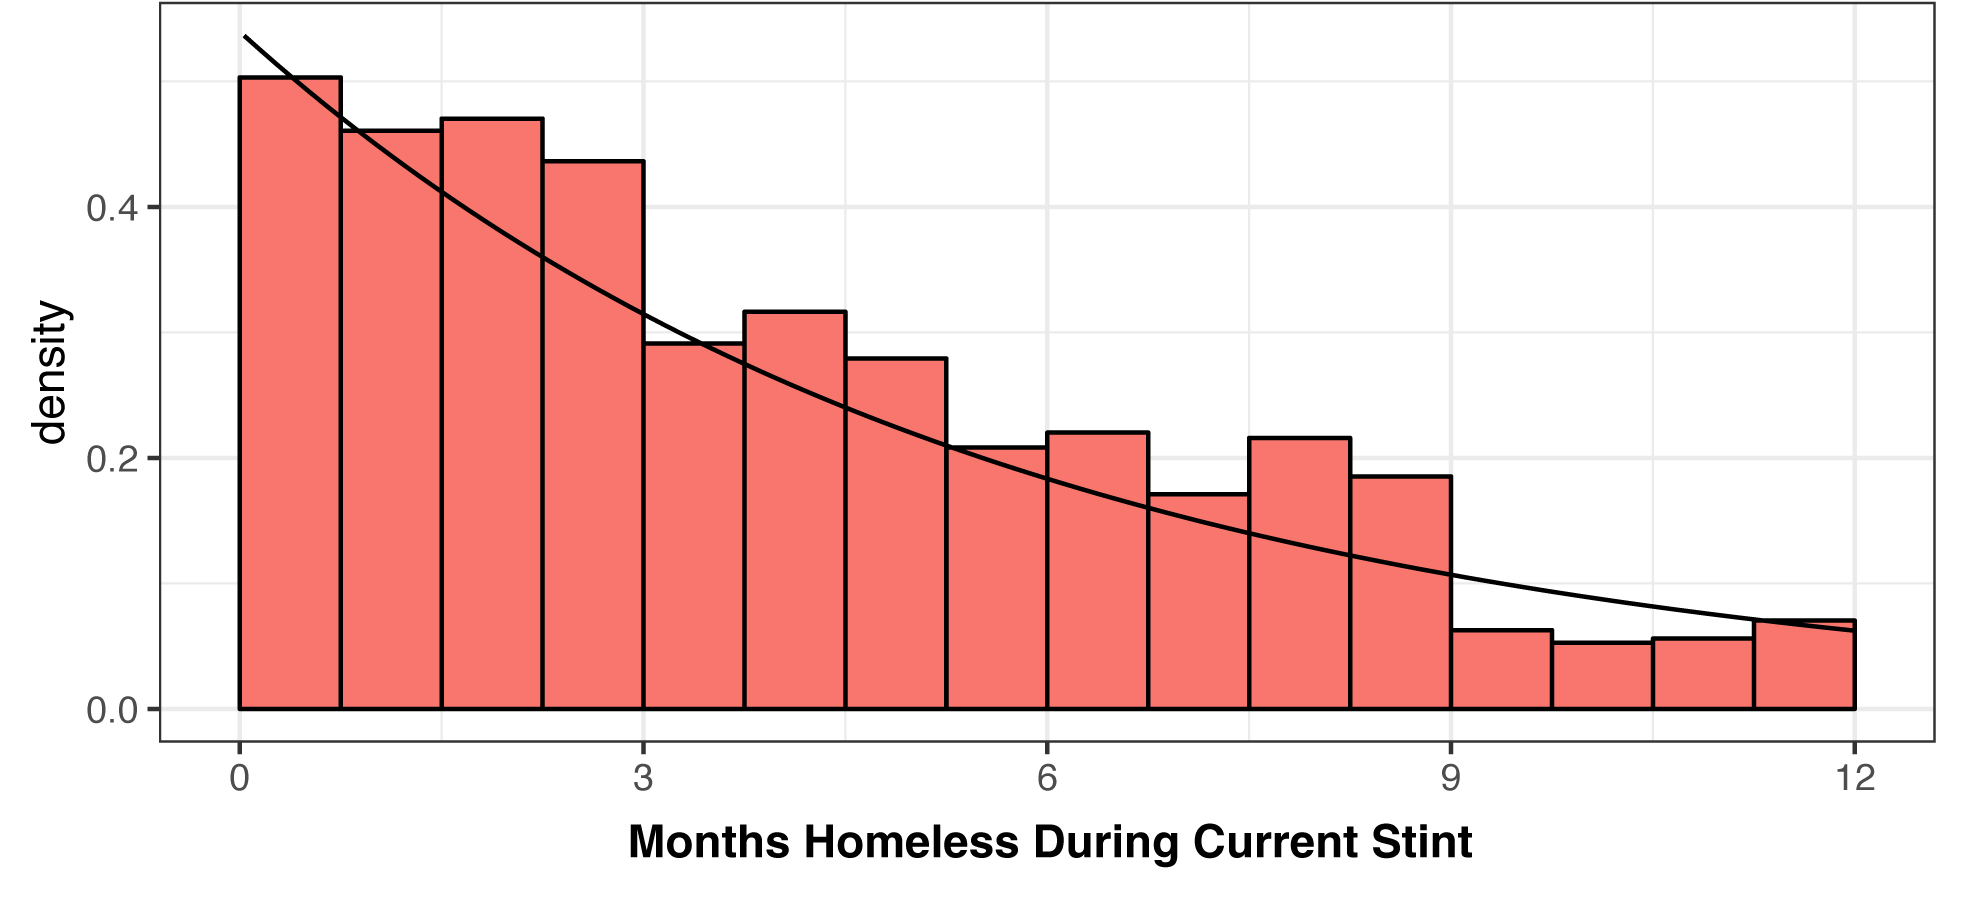 The population model developed by the Economic Roundtable uses point-in-time (PIT) information collected during the 2017 homeless count, conducted by the Los Angeles Homeless Services Authority, about how long individuals say they have been homeless. This information is collected while people are still homeless and before it is known how long they will continue to be homeless. This self-reported information tends to be rounded, creating inaccurate population clumps. We smoothed clumped data to generate the distribution shown by the bars in this graph.
The next step in the modeling process was to fit a distribution curve to the smoothed data, shown overlaid on the bars in this graph. The shape of the curve implies exit rates from homelessness. We use this information to construct the last two columns of the next table, which describe the homeless population over a year. Those columns also depend on an estimate of the probability that individuals experience multiple stints of homelessness during a year, based on data from the homeless count.
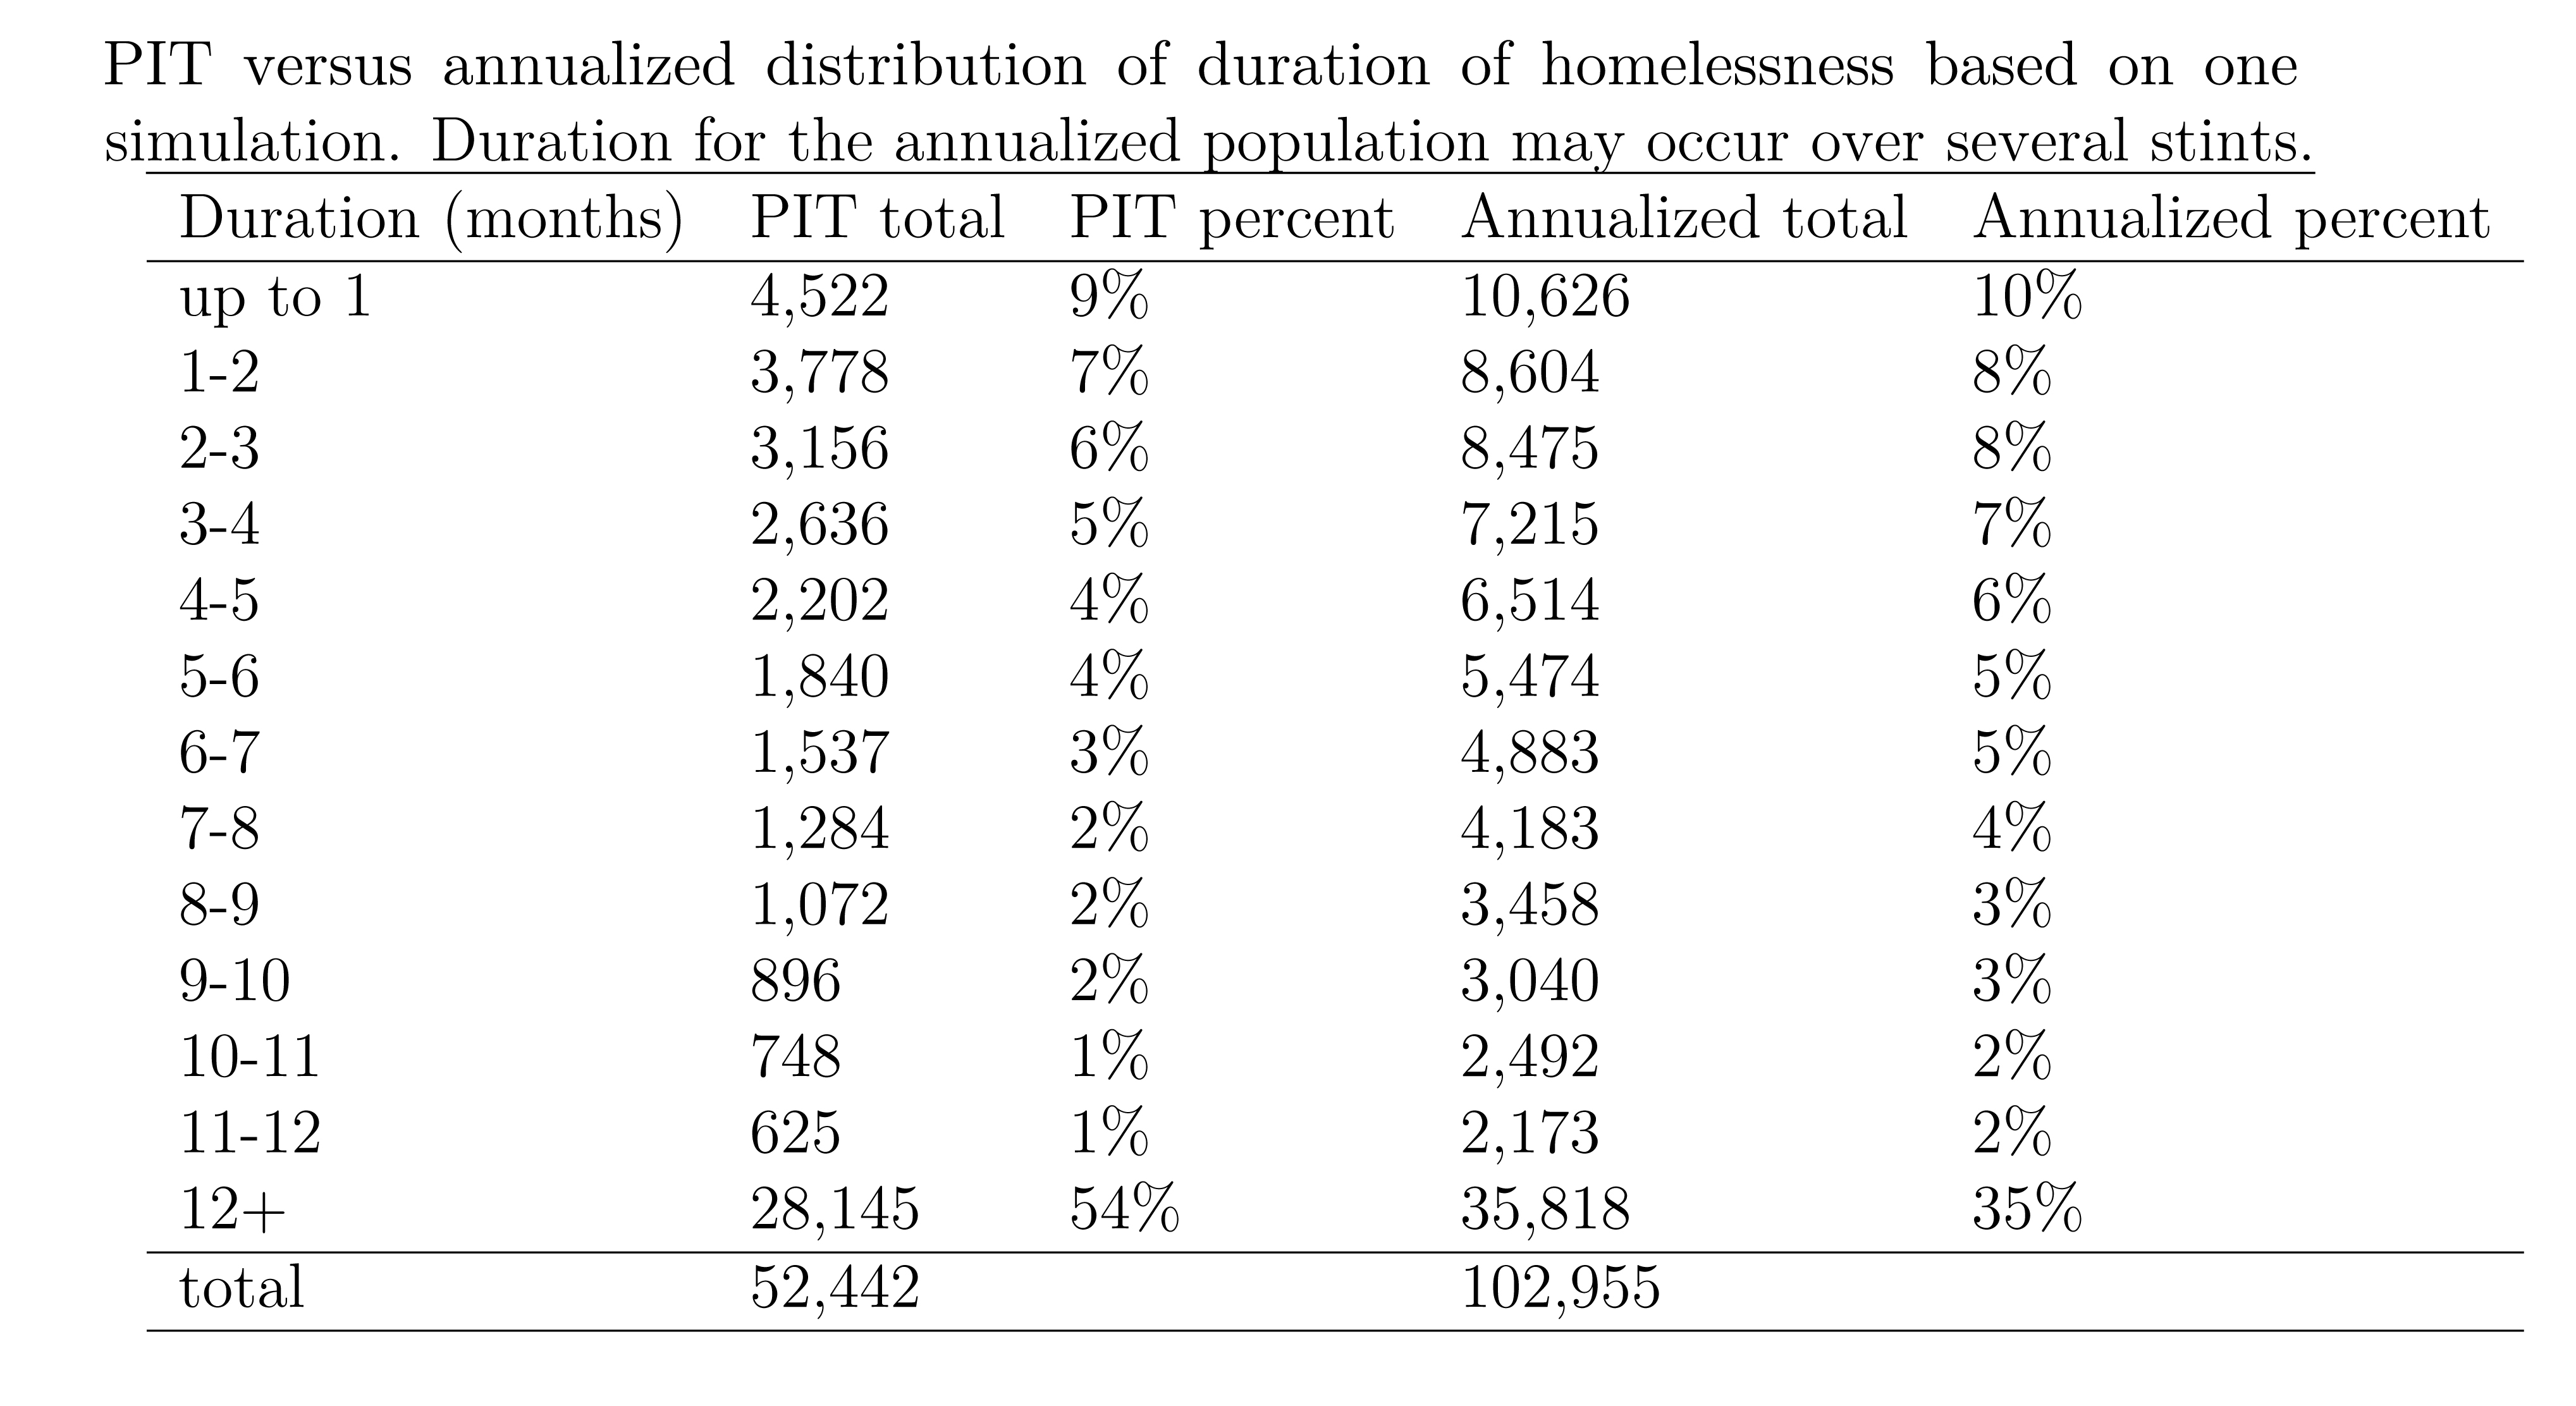 The second and third columns of the above table break down the point-in-time population of about 50,000 by duration of current stint of homelessness, using the curve fit shown in the graph above. The point-in-time distribution represents the population that service providers are estimated to see on a given day. The annual distribution shown in columns four and five represents the total population they are estimated to see over the course of a year.
For the annual population, the duration of homelessness may encompass multiple stints during a year. The annual distribution is useful for anticipating annual caseloads and developing and budgeting service models to provide progressively more intensive services for groups with longer homeless stints based on the increasing difficulty they experience in becoming stably housed.
This population model was developed using statistical software in R. A markdown file containing the code used to produce the model can be downloaded here and the open source GitHub repository for code and data can be accessed here.
 The estimation method presented in this report builds on the work of many volunteers who participated in the data dive that Economic Roundtable held with DataKind in July, 2018. At this event, over 40 data scientists in Los Angeles and San Francisco applied their skills to analyze Los Angeles Homeless Count data.
We especially want to thank the members of the team that worked on annualized population size estimation: Harry Brisson, Po-Nien Chiang, Johanna He, Geovani Montoya, Bradley Rava, Mark Rodighiero, Giovanni Rosati, Sameer Soi, Fishu Wu, David Ami Wulf, and Tian Yang.
PRESS COVERAGE AND ARTICLES
Is L.A.’s homeless population closer to 100,000? Nonprofit offers an alternative view of the data
By Doug Smith, Los Angeles Times (September 18, 2018)
Discussing methodologies: A nonprofit estimates that LA’s homeless numbers are significantly higher than suggested by the homeless count
By Larry Mantle, Southern California Public Radio, AirTalk (September 19, 2018)
L.A. County May Have Twice As Many Homeless
By A Martínez, Southern California Public Radio, Take Two (September 20, 2018)