Background and Impacts of this Study
In June 2015, the San José City Council prioritized an updated of the San José Rental Dispute Mediation and Arbitration Ordinance (Municipal Code Chapter 17.23, referred to as the Apartment Rent Ordinance or ARO) as its second highest policy priority for FY 2015-16. The ARO applies to over 45,000 units built before 1979, one-third of the city’s rental housing stock. The San José Housing Department was tasked with beginning this process and developed a work plan to carry out the Council’s priority, which led to several important updates approved in April 2016. These council-approved updates include: lowering the city’s annual allowable rent increase from 8 percent to 5 percent, removing the debt-service pass-through provision, modifying the capital improvement program, establishing anti-retaliation and protection ordinance to help tenants, and establishing a new rental registry to collect data on rent increases, tenant turnover and non-compliance. Our report also recommended the city increase the annual allowable rent increase rate based upon inflation, but this was not approved.
This Economic Roundtable study contains our analyses that helped inform the San José City Council and Housing Department staff in the winter of 2016, including:
- Demographic characteristics of San José ARO tenants
- Comparison of ARO and non-ARO rents
- Characteristics of ARO Apartments
- Comparison of Allowable Rents Increases under ARO with CPI and Allowable Increases under other Rent Stabilization Ordinances
- Analysis of debt-service pass-through
- Financial outcomes of ARO rental properties
This following is a summary of the report’s key findings, from before the recent council-approved updates to the.
Characteristics of ARO Apartments
The ARO was adopted in 1979 and applies to multifamily rental units in buildings with three or more units constructed before September 7, 1979. Among these apartments, those that are occupied by Section 8 tenants, owners-occupied, or that received public subsidies are exempt from coverage under the ordinance. Currently, approximately 44,300 apartments, or about one-third of the rental units in the City, are subject to the ARO.
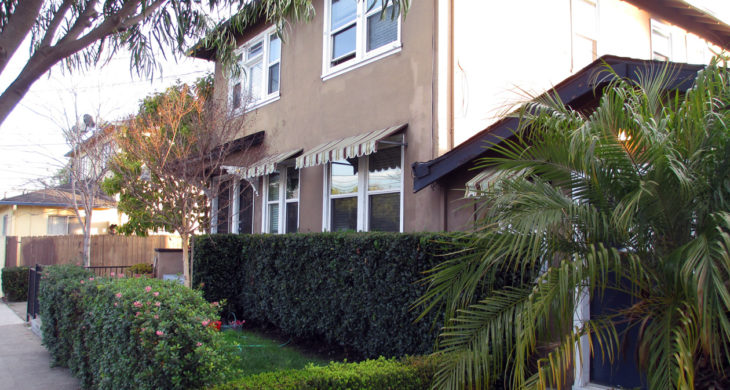
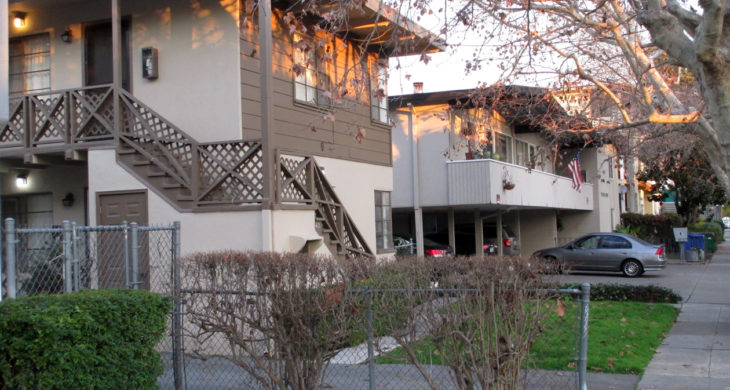
Forty-one percent of ARO units are in smaller buildings between 3 to 9 units. Thirty-six percent of ARO units are in larger buildings of 20 or more units. The table below sets out the distribution of the units by building size:
| ARO Units by Building Size | 3 or 4 Unit Bldgs. | 5 to 9 Unit Bldgs. | 10 to 19 Unit Bldgs. | 20 to 49 Unit Bldgs. | 50 + Unit Bldgs. | City Total |
|---|---|---|---|---|---|---|
| Percent | 21% | 19% | 23% | 26% | 9% | 100% |
Approximately three quarters of the units are concentrated in three council districts: Council Districts 1, 3, and 6. With respect to building age, 42 percent of all units subject to the ARO (ARO units) were built in the 1960s, with another third of ARO units built in the 1970s.
Since 1990, median rent increases for ARO units have exceeded those for non-ARO units on both an absolute and percentage basis. Median rents for ARO housing units rose from $618 to $1,306 from 1990 to 2014, an increase of 111 percent compared with an increase in the CPI-U All Items of 91 percent. In “real” inflation adjusted dollars the increase was from $1,181 to $1,308 during this period, an 11 percent increase.
For most years, increases in actual ARO rents mirrored the rate of inflation. The exceptions are the boom years of the dot.com era and the most recent strong housing market from 2012 to the present, during which ARO rents increased faster than the rate of inflation and led to excessive rent increases due to the high annual allowable rent increase.
Median rents for non-ARO housing units rose from $733 to $1,502 during this period. In real “inflation adjusted” dollars the increase was from $1,401 in 1990 to $1,504 in 2014, a 7 percent increase. The gap between ARO and non-ARO rent levels has narrowed: while the non-ARO median rent was 21 percent higher than the ARO median rent in 2009, that gap has narrowed to just 15 percent by 2014. Information about the ARO unit inventory and the socioeconomic and demographic characteristics of ARO renters is set forth in Chapters 1 and 2.
In recent years, San José has also had a rising number of tenant complaints in buildings with ARO units. Since 2012, tenants have filed about 70 complaints to the Housing Department per year about annual rent increases in excess of the then ARO-allowed 8 percent. Other common complaints concern service reductions in violation of current leases, improper “no cause” eviction notices, and housing code violations, totaling 792 petitions filed between 2010 and 2015 (approximately 160 petitions per year).
Housing quality, gauged by San José Code Enforcement service level “tiers” assigned to each building, show that more recently built ARO units are in better condition than older ARO units. Just 12 percent of ARO units built in the 1970s are assigned Service Level Tier III status, requiring inspections on a 3-year cycle because of the number and severity of documented housing code violations found. Over half of those built in the 1940s and 1950s are in Service Level Tier III.
Profile of Renters Living in ARO Units
Renter living in ARO units have lower incomes than non-ARO renters. The median household incomes of non-ARO renter households was nearly $8,000 higher than the incomes of ARO renter households in 2014, the latest year of data available.
Renter households in ARO units are slightly more rent burdened than those in non-ARO apartments in San José. Fifty-six percent of ARO renters pay 30 percent or more of their income for housing compared to 52 percent of non-ARO renters.
Also, there are higher rates of overcrowding in units covered by the ARO than those that are not. Thirty-nine percent of ARO units have more than one person per room versus 31 percent of non-ARO units. Ten percent of ARO units are severely crowded (greater than 1.5 persons per room) versus 8 percent of non-ARO units.
ARO units have a significant amount of turnover, with 26 percent of renters residing in their current units less than 12 months, and 37 percent for less than two years. Another 32 percent have resided in ARO units 2-4 years, and only 31 percent have lived there 5 years or longer.
The demographic data on renters living in ARO units reveal that they are slightly younger than non-ARO renters, and significantly younger than San José’s other residents. The plurality of ARO unit renters are Latino households (49 percent), with Asian American and Pacific Islander households constituting another 24 percent. Fifty-five percent of ARO renters are citizens either born in the United States, or else were born overseas to U.S. parents. Another 14 percent are U.S. citizens by naturalization.
Forty-nine percent of ARO renters do not have an education beyond high school, versus 42 percent for non-ARO renters.
ARO renters have the largest share of residents who speak English “Not Well” or “Not at All” (32 percent) versus 29 percent for non-ARO renters. Further contextual information about the ARO unit inventory and the socioeconomic and demographic characteristics of ARO renters appear in Chapters 2 and 3.
Standards for Allowable Rent Increases and Increases in Market Rent Levels
Before being updated in 2016, annual rent increases of 8 percent were permitted under the ARO. Additionally, “vacancy decontrol” applies to new tenancies when there is a voluntary vacancy. At the commencement of new tenancies that follow voluntary vacancies, apartment owners can set new rent levels without being restricted by the 8 percent ceiling. Typically, within a two-year period the rents of over one-third of all apartments may be set without any limit due to voluntary tenant turnover, and within a five-year period the rents of over two-thirds of all units may be reset without limits due to turnover.
The ARO’s prior annual increase allowance of 8 percent was significantly higher than most of the annual allowable rent increases under the other ten rent stabilization ordinances in California. The ordinances of Los Angeles, San Francisco, Oakland, Berkeley, Santa Monica, West Hollywood, and East Palo have generally limited annual increases to the rate of inflation or a portion of that rate, as measured by the rate of increases in the Consumer Price Index (CPI). From 1979, through 2000, the average increase in the San Francisco-Oakland-San José area CPI-U All Items was 3.3%. From 2000 through 2014, the average increase in the CPI-U All Items was 2.6%.
Also, in most years, the annual allowable increases under the ARO have been above the annual rate of increase in market rents in the San Francisco Bay Area, which has averaged 4.7 percent since 1980. As a result, the ARO has had little, if any impact, on overall rents. Overall, the annual increase allowed by the ARO has still been far above the average rate of inflation and the rate of increase in market rents over time. The ARO does provide some protection for in-place tenants from the possibility of increasing rents by more than 8% arising out of the significant increases in market rents of the past few years. Further information about standards for allowable rent increases and increases in market rent levels appears in Chapter 4.
Fair Return
In addition to the 8 percent per year annual increase, pursuant to the ARO’s current standard for rent adjustments for individual buildings through a petition and hearing process, apartment owners may obtain rent increases to cover mortgage payments (“debt service”) or increases in operating expenses since the prior year. Owners may also obtain rent increases to recover the amortized cost of capital improvements or rehabilitation. The allowance of a debt-service pass-through provides an opportunity for recent purchasers of ARO apartments to obtain substantial rent increases based on their new purchase mortgages. Under most rent stabilization ordinances in other jurisdictions, increases in debt-service are not considered as a factor in setting allowable rents.
The most common type of fair return standard under rent stabilization ordinances is a “maintenance of net operating income” (MNOI) standard. Net operating income is determined by subtracting operating expenses from gross income. Under this type of standard, “base” year net operating income adjusted by a CPI factor, since a base year net operating income is considered a fair return. (For example, if the net operating income in the base year was $100,000 and the CPI has increased by 75% since the base year, the fair net operating income in the current year would be $175,000.)
Net operating income is the portion of income available to cover debt service and to provide cash flow. By maintaining net operating income, this MNOI standard insures a right to rent increases adequate to cover increases in operating expenses and capital improvements. Unlike San José’s individual rent adjustment methodology, an MNOI standard does not provide for separate pass-throughs of increases in debt service. The MNOI standard has been consistently upheld by the Courts as producing a fair return. Chapter 5 contains further discussion of fair return issues.
Financial Outcomes of Apartment Owners
Operating expenses of San José apartment buildings subject to the ARO are in the range of 25 percent to 45 percent of revenues. These operating cost ratios result in net operating income-to-rent ratios in the range of 55 to 75 percent. This average has remained stable over time. Some types of operating costs, typically utilities and government assessments have increased at a greater rate than the CPI. However, these costs are usually small relative to rental income. For example, there have been steep increases in water costs. But water costs are typically equal to about only two percent of rental income; therefore increases in these costs have a very small impact on overall profitability. Annual increases in the largest apartment operating expense, property taxes, are capped at 2% per year, except when a property is sold.
The values of San José apartments constructed before 1980 and, therefore, subject to the ARO, have increased substantially. Average values doubled from 1995 to 2000 (from $50,000 to $100,000 per unit) and have doubled again since 2000, to an average of about $190,000 per unit. Overall they have quadrupled in 20 years. The increases in value are attributable to the combination of increasing net operating incomes and declining mortgage interest rates. Overall owners of apartments subject to the City’s ARO have obtained attractive returns from their investments as a result of increasing rents and net operating incomes and appreciation in the values of apartments. The financial outcomes of ARO apartment investments are discussed in Chapter 6.
Related Articles
San José recommends 5 percent limit on some residential rent increases
By Janice Bitters, Silicon Valley Business Journal (February 1, 2017)
San José City Council approves critical change to rent control policy
By Ramona Giwargis, San José Mercury News (January 31, 2017)
Rent control measures in the Bay Area
By Rose Aguilar & Malihe Razazan, All Things Considered from NPR / KALW 91.7 FM (September 7, 2016)
Inequality and Economic Security in Silicon Valley
By Luke Reidenbach, California Budget & Policy Center (May 2016)
San José City Council Meeting Approves Changes to Apartment Rent Ordinance
By staff, KRON 4 / Bay City News (April 20, 2016)
San José Rent Control: A Look at All The Proposals
By Ramona Giwargis, San José Mercury News (April 15, 2016)
San José: Rent Control Changes Are Coming — But How Much?
By Ramona Giwargis, San José Mercury News (April 15, 2016)
San José Councilman: Landlords Should Pay to Move Displaced Tenants
By Ramona Giwargis, San José Mercury News (April 11, 2016)
San José Staff Recommends Tying Allowable Rent Increases to Inflation, No Action on Just-Cause Eviction Law
By Bryce Druzin, Silicon Valley Business Journal (March 2, 2016)
San José: Proposal to Tie Rent Control to Inflation
By Ramona Giwargis, San José Mercury News (March 15, 2016)
San José rent-control study casts doubt on program’s effectiveness, but what now?
By Nathan Donato-Weinstein, Silicon Valley Business Journal (February 3, 2016)
All Those Vacant Homes
By Jed Kolko, Trulia Housing Policy Blog (November 6, 2013)
Related City of San José Information
- City of San José Housing Department, Apartment Rent Ordinance
- City of San José Planning, Building & Code Enforcement Department, Multiple Housing Program
- City of San José City Council Meeting Agenda / Audio Recording, April 19, 2016
- City of San José City Council Meeting Agenda, May 10, 2016

