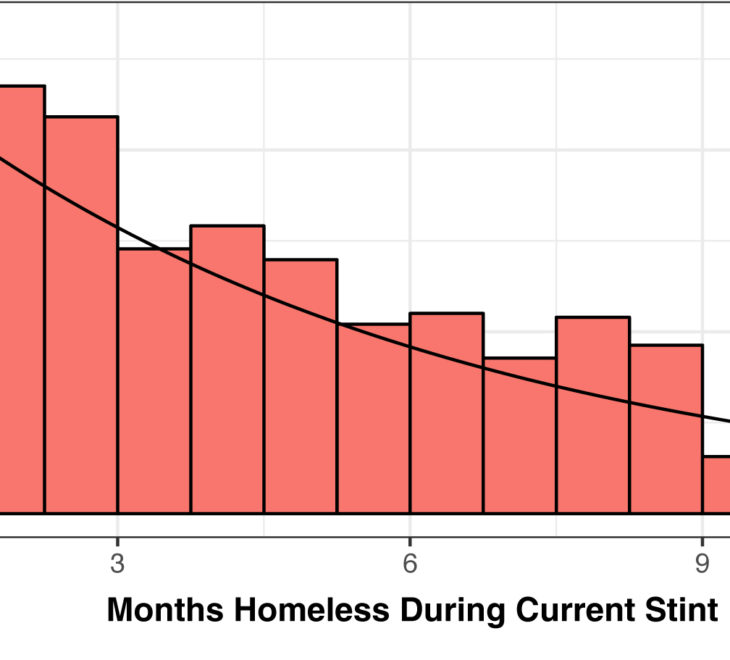
User options for visualizing homeless data include comparing results from 2016 and 2017 for everyone who was homeless or for individuals who were sheltered or unsheltered, and subgroups broken out by gender, ethnicity, age, as well as a menu of detailed population characteristics. Results that can be compared include the size of each population group in 2016 and 2017, as well as the reasons people in each group gave for the cause of their homelessness, and their employment status.
The Economic Roundtable partnered with DataKind to organize a data dive in which volunteer data scientists developed tools for describing LA’s homeless population over time. Paul Beeman led the effort to build this interactive tool for visualizing data from the 2016 and 2017 homeless counts, working in collaboration with Lisa Ann Yu, a volunteer data scientist. The source data was produced and shared by the Los Angeles Homeless Services Authority (LAHSA). Allow a few seconds for the data visualization tool to load.
Press Coverage:
Is L.A.’s homeless population closer to 100,000? Nonprofit offers an alternative view of the data
By Doug Smith, Los Angeles Times (September 18, 2018)