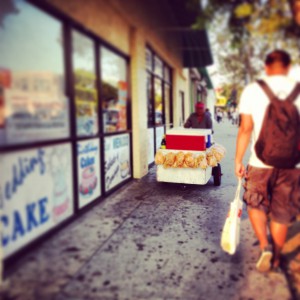
Photo by Rudy Espinoza, November 2013
Los Angeles has 50,000 street vendors, according to estimates by the Bureau of Street Services.[1] They generate over $504 million in annual sales of food and merchandise. One-fifth of the street vendors, 20 percent, prepare and sell food-related products, sales of which total over $100 million a year. The majority, 40,000 vendors, sell non-food items, such as clothing and electronics, generating over $403 million in annual revenue.
Economic Roundtable mapped the locations of street vendors and brick and mortar retail and restaurants in Los Angeles. We found that only a quarter of stores and restaurants were located in proximity to street vendors, however, stores near vendors were more likely to experience job growth.[2] Retail stores and restaurants that were further from vendors lost more of their employees over the course of five years. On average, businesses lost five percent of their jobs when they fell in Census blocks with no or few street vendors. On the other hand, businesses in close proximity to street vendors maintained employment levels from 2007 to 2011 and grew, on average, by five percent.
We found that businesses located close to a vendor maintained higher levels of employment, on average, than those far from vendors. In 2007, the first year of the Great Recession, the average difference in employment between retailers close to vendors and those far was five workers. By 2011, two years after the official end of the recession, establishments near vendors employed double the number of workers than their counterparts not in geographic proximity.
Studies show that brick and mortar stores suffer when vendors leave the neighborhood. Chicago’s Maxwell Street Market was one of the nation’s largest open-air market of street vendors that was established in the late nineteenth century. In 1994, the market was shuttered to make room for the expansion of a local university. As a result, economists estimated that there were $49.3 million in total losses to the business ecosystem that evolved around the market, including the customers and the neighboring brick and mortar businesses.[3] Many brick and mortar stores went out of business because they lost the foot traffic attracted by the market.
Download our neighborhood fact sheets here.
[1] Tso, Sharon M. Nov. 26, 2014. City of Los Angeles Sidewalk Vending Status Report. Report of the Chief Legislative Analyst to the Economic Development Committee.
[2] We measured proximity based on whether a brick and mortar establishment was located in the same 2010 Decennial Census block as a street vendor (based on coordinates from the Bureau of Street Services and neighborhood surveys by UCLA Urban Planning students, Mark Vallianatos, Occidental College, and East LA Community Corporation). Business data was obtained from the Quarterly Census of Employment and Wages, 2007-2011, California Employment Development Department. Census blocks are the smallest geographic units used by government agencies in gathering statistics about a place. In cities, a Census block roughly corresponds to an urban block.
[3] Morales, Alfonso, Steven Balkin, and Joseph Persky. “The Value of Benefits of a Public Street Market: The Case of Maxwell Street.” Economic Development Quarterly. Vol. 9, No. 4, November 1995, 304-320.